Introduction
InteGO2 is an easy-to-use web interface which can be used to calculate and visualize the gene-to-gene functional similarities based on GO.
InteGO2 supplies eight state-of-art gene functional similarity measurements for users, including an integrative approach that automatically choose and weigh appropriate measurements for the input genes. Currently, 24 organisms are available. The GO annotations of all organisms are downloaded from the GO website and are updated automatically to ensure that the most recent annotations are used.
There are two main processes to use InteGO2, including:
- input the parameters and gene list;
- visualize and download the result of gene functional similarities.
The input interface of InteGO2
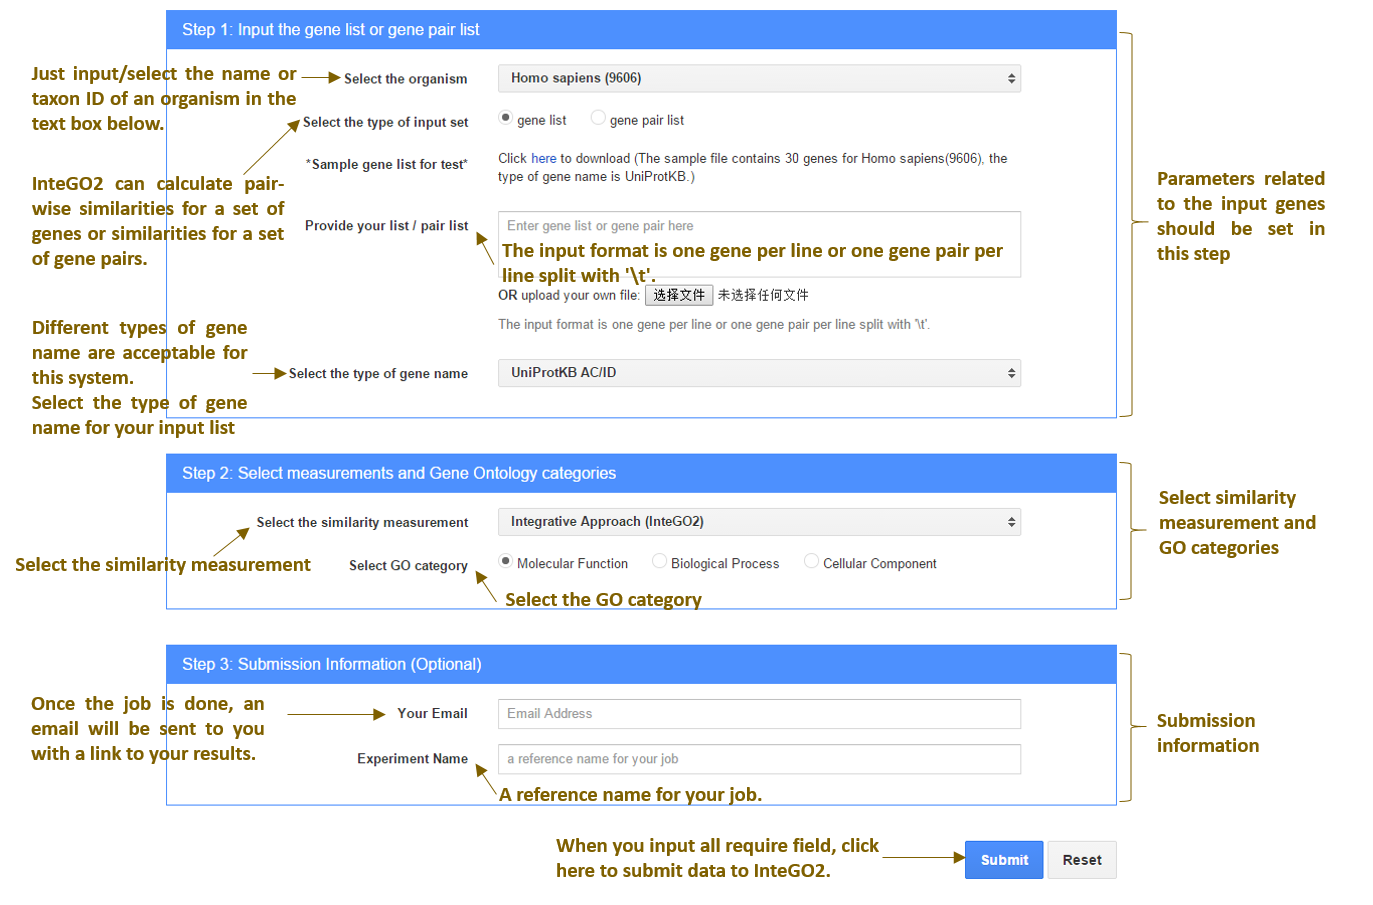
Fig.1 the input interface of InteGO2
After the user has submitted his/her data, InteGO2 validates the input for errors. The validation checks the format of input gene or gene pair list and all the options and parameters uploaded. The user is notified immediately, if any error is found. After the input data passed the validation process, InteGO2 starts to calculate the gene-to-gene similarities. The user could download and visualize the results, once the calculation process is done. At the same time, a link to the results and visualization interface is emailed to the user.
Download and visualize Similarity result
Once the calculation process is done, the user could choose to visualize the result or download it (see following page). The user also could visit the previous results saved on InteGO2 server via the runid.
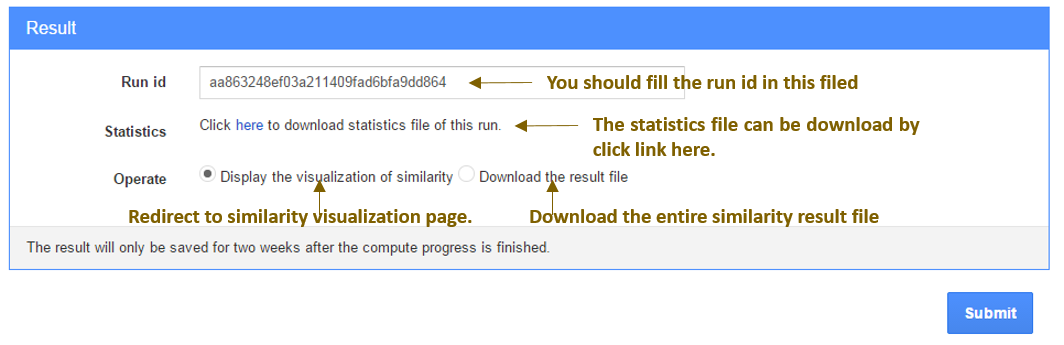
Fig.2 Result page of InteGO2
Following is the visualization interface of InteGO2.
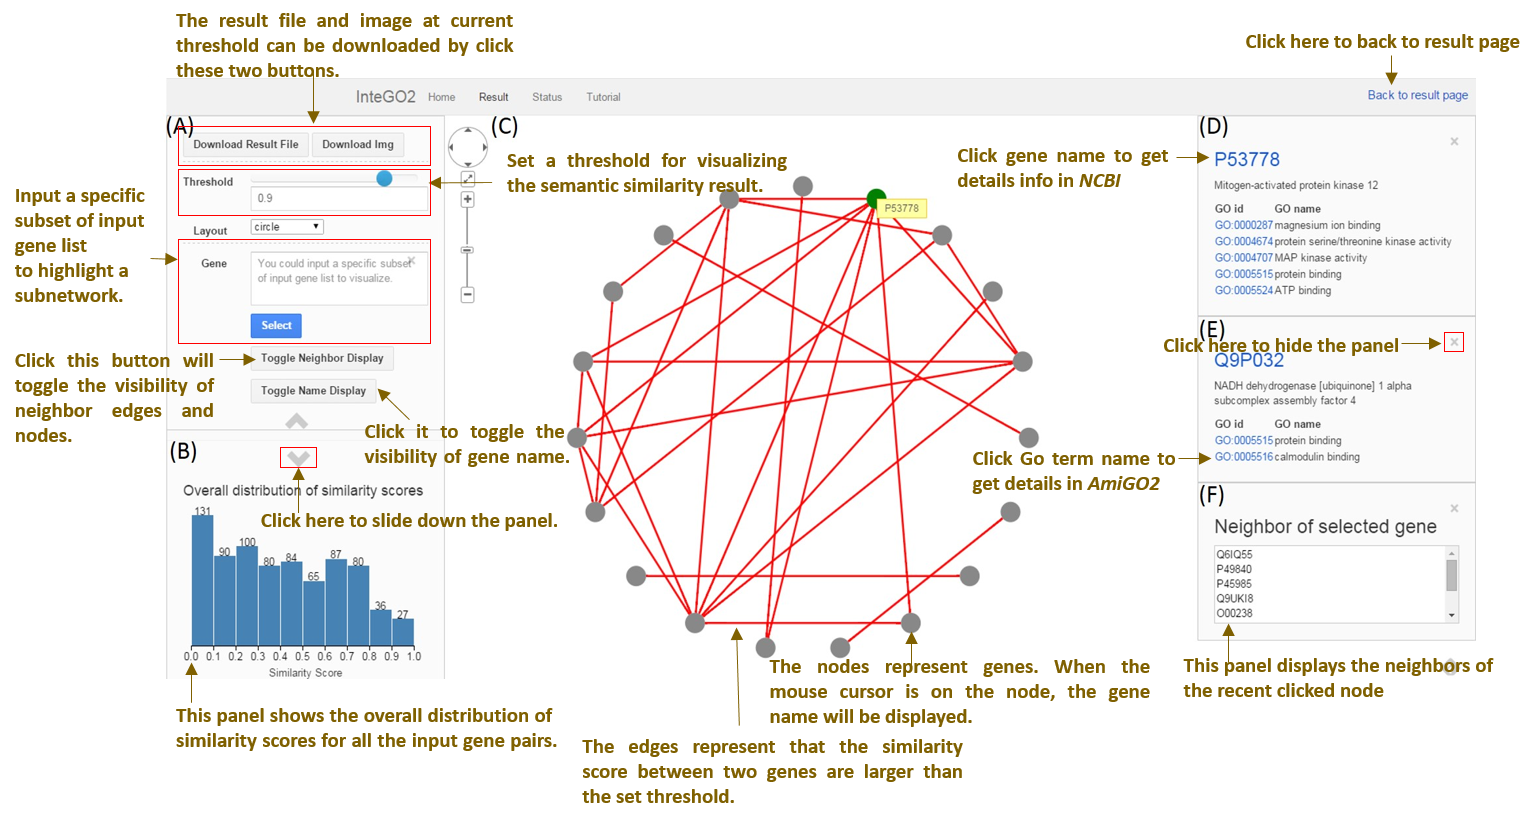
Fig.3 Visualization page
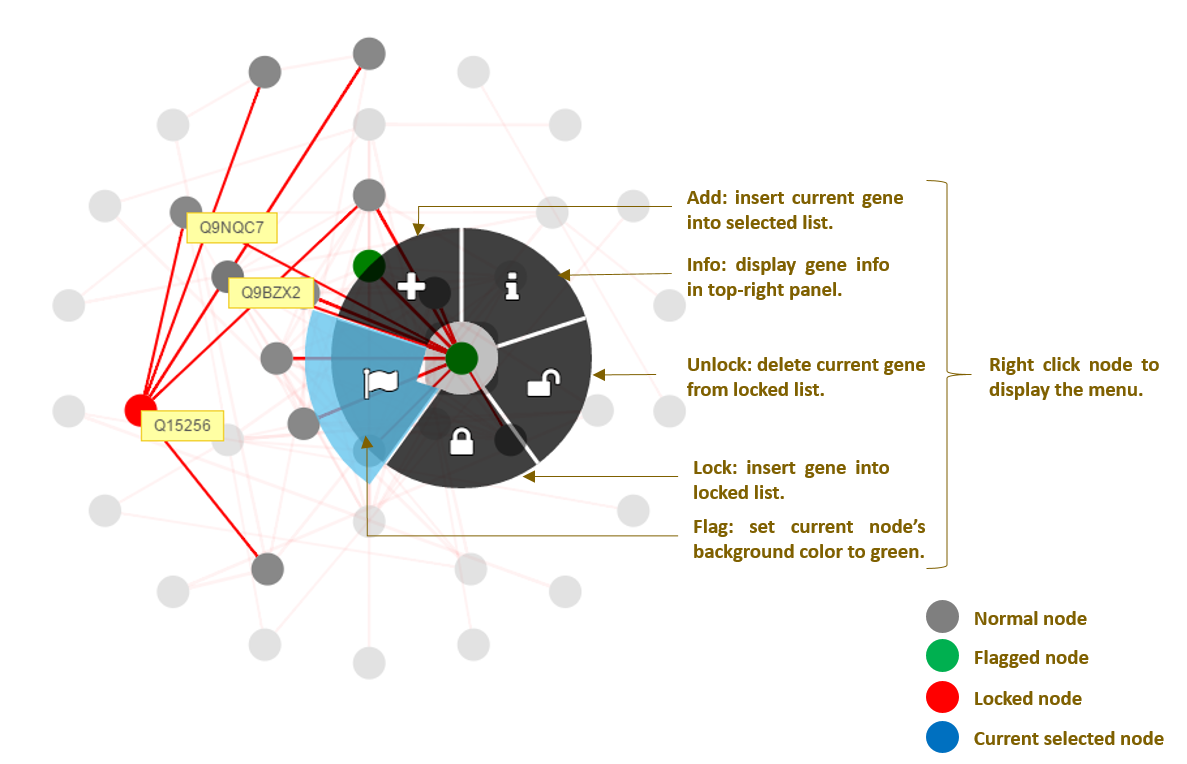
Fig.4 More detail about result visualization page
Note: The similarity result will only be saved for two weeks after the compute progress is finished.
Supplementary file
The supplementary file of "InteGO2: a web tool for measuring and visualizing semantic similarities using gene ontology" can be downloaded from here.